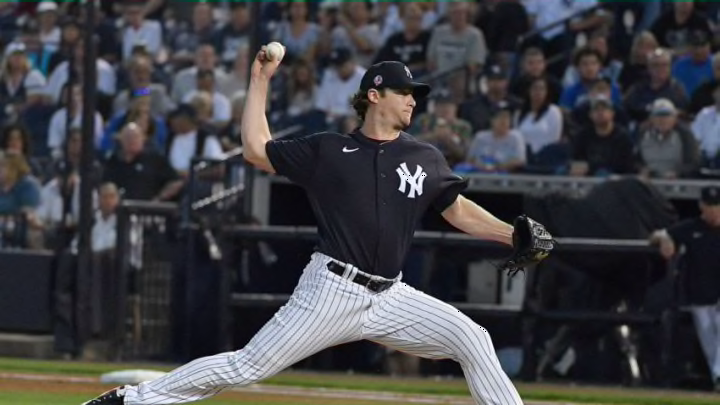
The New York Yankees signed star pitcher Gerrit Cole to be the anchor of their staff, but is he a prime regression candidate?

The New York Yankees signed Gerrit Cole to a massive contract this offseason, giving him $36 million a year for the next nine years to anchor their staff.
What if this turns out to be a significant mistake? There is plenty of room for regression and just down the road, but in the immediate future.
Why Gerrit Cole might regress for the New York Yankees
Several statistics point toward regression for Cole, if not this season, then very soon.
- Batting Average on Balls in Play – his career average in this category through the first five years was .316. It was only .288 in 2018 and .276 in 2019
- Batting Average Against – first five seasons – .254. The last two seasons – .198 and .186
- Home Runs Allowed – he only gave up 36 total home runs in his first four seasons. He surrendered 79 in his last three
- Home Runs Allowed to Left-Handed Hitters – first four years, 16, last three, 42
- Left on Base Percentage – his had never been higher than 74.9 until 2018 when it was 77.9 percent, then it rose to 83.3 percent in 2019
Now imagine that short porch in right field in Yankee Stadium.
With the Astros, according to Fangraphs, Cole almost stopped throwing his sinker completely. He only threw his sinker 3 percent of the time in 2018 and only .4 percent in 2019. He relied on his four-seam fastball more (over 53% both seasons) and curveball as well.
While his strikeout per nine innings has skyrocketed from a career-high 9 in 2014 to 12.4 in 2018 and 13.82 in 2019, his flyball ratio and home run per nine innings have also gone up.
Cole’s flyball percentages and HR/9:
- 2013 – 26.1% / .54
- 2014 – 31.8% / .72
- 2015 – 29.6% / .48
- 2016 – 29% / .54
- 2017 – 33.7% / 1.37
- 2018 – 42.7% / .85
- 2019 – 39.4% / 1.23
Gerrit Cole’s batted ball chart for flyball and home runs by left-handed hitters
Notice all those black dots in rightfield? Those are home runs. Now imagine that short porch in right field in Yankee Stadium.
Cole gave up only 66 total runs last year. He also gave up 29 home runs. An 83.3% left on-base percentage hardly seems sustainable, even when he can pitch his way out of trouble with strikeouts much of the time.
Gerrit Cole is a terrific pitcher still in his prime. He was the best pitcher available, and if a team is going to take a chance on someone, Cole seems like a reasonably safe bet. However, there are some areas where it might be hard to duplicate or sustain for more than a year or two.
When you look at his BAA and BABIP over the last two seasons, some of his incredible numbers can be attributed to him evolving into a dominant pitcher, but there is also a lot of luck involved in those numbers.
Time will tell if the New York Yankees made a big mistake signing Gerrit Cole to such a long and lucrative deal. He is terrific now, but how long will it bee before his numbers start trending the wrong way across the board? Will Cole be this good for the next nine years?
